Using node.js
Time compressed video of Irish railway data from November 30th 2012.
update notes 2/11/2021
After many years…. I was able to get this running
- in the project folder (ie., /trains)
- npm init
- then do: npm install <package> for these packages:
- request
- xml2js
- util
- http
- ws
- then just ran: node max-train1.js and started polling in train-drawing4.maxpat and the data started rolling in
- webSockets code was replace using ws library
Also using sample webSockets code from here to handle the map points: https://masteringjs.io/tutorials/node/websockets
Next steps:
I would like to update all of this in node for max – but its also nice to have an example of doing OSC communication with Max the old way.
Original documentation follows
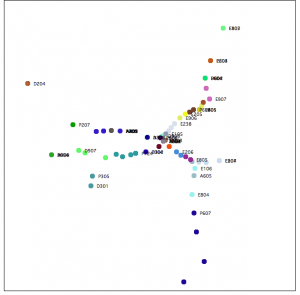
This map is centered on Dublin. Each train is a different color and the train number gets printed next to the current position. So for example you can see P607 coming into Dublin from the South.
It gets updates every 10 seconds or so – but sometimes the trains seem to ‘jump’ so I don’t think the actual data itself gets updated that fast.
download
https://github.com/tkzic/internet-sensors
folder: trains
files:
main Max patches
- max-train3.maxpat
- train-drawing4.maxpat
abstractions and other files
- data_recorder_list-tz.maxpat
node.js
- max-train1.js: (main server)
- bigInt.js: (Osc support)
- byteConverter.js: (Osc support)
- libOsc.js: (Osc library)
- max.html: (the web client file – runs in browser)
node.js installation
Install node.js on your computer (or a separate server). Instructions here: http://nodejs.org
In a terminal window go to the project folder ie., /internetsensors/trains
type: npm init
(just accept all the default values)
The following node packages are required. Install using npm. For example:
type: npm install request
Do the same with all these packages
- request
- xml2js
- util
- http
- ws
instructions
These instructions are a bit confusing. A simpler UI is in the works. (that’s funny – I said it 8 years ago)
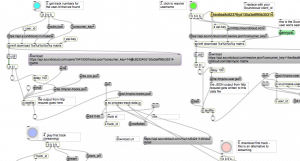
- Open both Max patches: max-train3 and train-drawing4
- To run the server, open a terminal window, go to trains folder, and type:
node ./max-train1.js
- Back in Max, in train-drawing4, you can start and stop polling with the toggle button in the upper left corner. If you want to toggle playback from the data recorder, you’ll need to have some data recorded – or load a file (this is done from max-train3)
- In max-train3, select a preset in the preset object. Try the top left one, The presets go from low res to high res on Dublin (left to right).
- You can load train-data1.txt by clicking read message on the data recorder. Then press play, or use metro (set to low number) for high speed.
- In train-drawing4 you’ll need to manually clear the lcd and lcdsprites in the drawing section.
- In max-train3 you can clear the color database using labeled button (if the train names don’t print on the map)
Running the chat thing
When you connect to the node server in a web browser, for example using the following url:
http://localhost:8124
You will get a message welcoming you and asking you to enter your name. After you enter your name, Max will send you a response. Then you can enter map points using the following format:
Dublin 53.15 -6.90
The map point will be drawn on the map in the Max patch.
how does it work?
Data communication is done with OSC messages. Here’s how
- Max sends a /getTrains message to a node.js server
- The server runs an http: request to the Irish rail API
- The server parses the response data and sends back a bunch of /train name x y messages. to Max
- You can also connect to the node server from web browsers in kind of a ‘chat’ thing (using Web sockets) and enter geographical place names with lat/lon – which get pinned to the map – and Max sends back personalized thank-you notes.
Here’s what the raw data looks like:
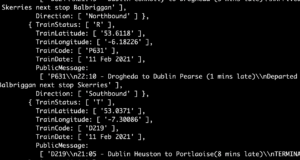
Note: if there’s no data at this link, check the time of day. Trains stop running around midnight UTC.
Programming:
Essentially what this program does is collect current train position data from Ireland and display it as points on an XY grid.
components:
- Max/MSP
- node.js
- Web browser
- Irish train API
Server
The server is written in node.js. This was my first real project using node. So I tried to make it do a bunch of things, just to test them out.The necessary features are
- web server to make http: requests to get the train data
- UDP server to pass data and messages back and forth from Max to node.js using Osc
- convert XML train data to JSON,
- convert point data from lat/lon to XY format
- chat server using socket.io which allows several web browser sessions to connect to the server, talk with each other, send point data to Max, and receive acknowledgement from Max
This is probably the most confusing part about this program. You can run it on the Mac in localhost mode, or you can run the node.js program on a separate server, as long as there is a direct ip path back to the computer where Max is running. Running a separate server makes more sense if you are using the chat or a remote web control aspect of this. I have run the node program on a Ubuntu server on my local network without making any changes other than to the IP addresses as explained next.
You need to make 2 changes to go from localhost mode, to separate server mode:
In the client program, max.html – near the top, change the ip address from localhost to the specific ip like this:
// note: if you want to run this program on something other than localhost, then put in the ip
// address of the server here, instead of local host...

//     var socket = io.connect('http://localhost:8124');
//
       var socket = io.connect(192.168.1.10:8124');
In the server program, max-train1.js – change the destination address for UDP to the address of the computer where max is running:
var dSendAddress = '127.0.0.1';	// send response messages to max at this address
// do this if max is running somewhere other than the same computer as the node server
// var dSendAddress = '192.168.1.104';	// send response messages to max at this address
Also in the Max patch max-train3.maxpat you will need to change the [udpsend] object to give it the host address of the node server.
screenshots:
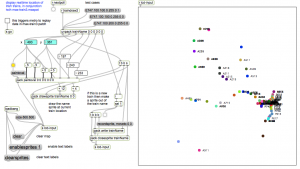
train-drawing4.maxpat
Data recorder:
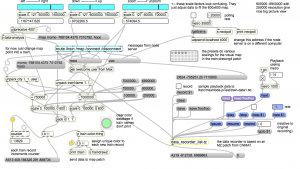
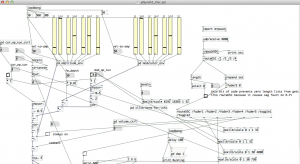
To be able to save and replay data I included a data recorder in the patch. Its a revision of the data recorder from CNMAT by Michael Z. This version
- works with lists that start with a symbol (not just ones that start with numbers)
- handles the time delta correctly on the first record
- adds additional transport controls, for example playback using a [metro] at any speed – and ability to goto a particular position in the data file
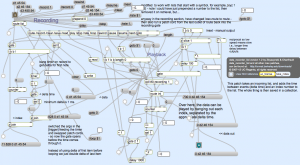
The actual code for the patch is horrendous. Its filled with debugging objects and is a maze of patch cords lacking explanation. But it works…
what’s next
- Make sure that the Max Patch loads a preset map setting by default
- put a timestamp message in the node console and Max console so we know at the end of a train list what the current time is.
- clean up instructions
- make a screencast do demonstrate how to use this needlessly complicated patch.
