
By Louis Lazaris at Sitepoint
http://www.sitepoint.com/5-libraries-html5-audio-api/
- webaudioox.js : experimental
- howler.js : audio playback and sprites
- pedalboard.js : guitar pedal simulation
- wad : build synthesizers
- fifer : audio playback
By Louis Lazaris at Sitepoint
http://www.sitepoint.com/5-libraries-html5-audio-api/
A web audio example by Gaëtan Renaudeau, in jsfiddle. Click ‘result’ to play.
Sencha Touch 2.x has an SDK
Getting started: http://docs.sencha.com/touch/2.3.1/#!/guide/getting_started
Local folders
Sencha Fiddle (for online testing) https://fiddle.sencha.com
“An interactive exploration of Boston’s subway system”
By Mike Barry and Brian Card – June 10, 2014

Version 1.1 update to Blob now available in the iOS App store.
http://zerokidz.com/blob/home.html

Blob (by Bjorn Lindberg) was converted in 2011 to run as a webApp using SenchaTouch 1.0 and Phonegap 0.94. Both of these frameworks have evolved to the point that the original code is no longer workable.
Here is an update to the Web app version: http://zerokidz.com/blob1.1/www/sencha-index.html
bugs
Like SecretSpot, The native app runs only in portrait orientation.
notes
After this update has been submitted to Apple, I will try to convert it to run in current versions of Sencha Touch and Phonegap. There is relatively small amount of Sencha code in the app: A main window, toolbar, canvas window, and a few customized buttons.
Lots of information in a few pixels.

Computer displays have evolved to high resolutions. What about the other direction? This experiment is a display interface using a grid of LED’s. Essentially, very large pixels.
LED’s communicate information using
With just a few LED’s its easy to display a clear message. A large matrix of LEDS can get confusing. Here are a few suggestions:
An effective but inefficient signaling method.

Resistors use a numeric color code.

Find the value of any resistor by looking at the first four 4 color bands. Colors represent base 10 exponential notation.
An abacus uses 5 or 10 beads for each digit. Faster than decoding a resistor and works with one color – but takes up more space.

Segmented level meters convey information using a line of pixels:

Represents digits using binary coded decimal notation.

This grid design was used for the visual interface of a shortwave radio:
And an etch-a-sketch:
https://github.com/tkzic/max-projects
folder: LED-display/rx-320/
files:
There are 2 large toggles – one for etch-a-sketch, and another for the radio simulator. Try one, then toggle it off before trying another one. If you forget – just restart the patch.
The number box near the top can be used to expand or contract the display size (while it is active) The default size is 17.
The same patch generated both video examples above. It uses javascript to make a two dimensional array of Max led objects. Each object is addressable by its position in the array. Here’s the code to make the objects:
//
// makecells - create matrix of led objects
//
function makecells( x, y, color )
{

var p;		// this patcher
var tmpstr;
var objname;

	post( "makecells: ", x, y, color );
	post( );

	p = this.patcher;

// make cells

	for( i = 0; i < x; i++ )
		{
		for(j = 0; j < y; j++ )
			{
			cell[i][j] = p.newdefault(xorigin + (i * cellspace), yorigin + (j * cellspace), "led" );    // create leds
			if(color != 9 )
				{
				cell[i][j].hidden = 0;
				cell[i][j].message( "pict", color );
				}
			else
				{
				cell[i][j].hidden = 1;
				}

			cell[i][j].varname = "led" + i + "x" +  j;							//  assigns name for future use
			}
		}

}

Although each LED in a grid is addressable, its easier to group sections of the grid into blobs. Each blob is a unit that displays data, like a number for example. There are several types of blobs:
Here are the properties of a blob:
//  blob data structure
//
//   x, y upper left
//   lengthx, lengthy,
//
//   orientation: 0 = horizontal, 1 = vertical
//   step  1 = downward or rightward,  -1 = upward or leftward  (this defines the corner of origin too)
//
//   data lorange, hirange
//   scale: 0 = no, 1 = yes
//
//   blobtype: 0 = generic decimal,  1 = spare,  2 = pushbutton flash,  3 = radiobutton,
//   color code 0-9
//   contrast color 0-9
//
//   signed ( 0 = no, 1 = yes)		// booooooooooooooolean
//   colorshift ( 0 = normal , 1 = use different colors every 3 digits, like comma separators (frequency display)
//
//   blink  (milliseconds duration for pushbutton flash type only (led blinktime )
//
//   radio number
//   name
//   value
//
//
Lets look at examples of various ways to display data – as used in the shortwave radio video above.
Here are 3 blobs that represent numbers in three different ways.

The far left column and the bottom row are key graphics. They give a frame of reference for the data.
Moving from left to right…
The LED’s far left column, are a graphic key, starting with red on the bottom, represent the numbers 1-9
The next blue column is just a divider
The 3rd column of white dots is the signal strength data ranging from the 0-9. The current value is ‘4’, represented by a column of 4 dots.
The next nine columns (4-12) represent the frequency in Hz. ranging from 0-999,999,999. The data is in groups of three (as you can see by looking at the graphical key in the bottom row). The number currently displayed is: 4,999,991.
Negative frequencies are displayed by shifting the colors to values that don’t match the key graphic.
The last column is a radio button with 4 possible values and is currently set to ‘3’
The bottom row is a key graphic, showing a different color, or group of colors for each data item. So for example, there is one white dot under the signal strength data in column 3. There are 3 groups of 3 dots (yellow, green, yellow) in columns 4-12 representing the frequency data in the format: 999,999,999.
The 2nd blue row from the bottom is a divider.
The next shows which data items are being controlled by modulators. The 3 white LED’s show modulation of frequency data in the million’s, 100’s, and ten’s places.
There are 5 modulator units in the display. Data is represented using a color code..
Gray LED’s represent ‘momentary’ controls in the off state. When a momentary button is pressed, it will blink white.
Here is an example of a modulator unit

The blue LED’s are just dividers (background space)
The first column of data on the left is the on/off indicator and the modulator’s ID number.
The top LED of the column is the on/off toggle. It is blank, which means off.
The next two red LED’s together represent the ID number of the modulator: red = 1
—
For the remaining columns, the top row indicates whether the input gate is open allowing other modulators to control the parameter. Grey indicates the gate is closed, A white LED means the input gate is open.
—
The second and third columns of data are the clock speed and wave type. The 2 LEDS in each column are grouped together and are using the color code above. The clock speed is 5 (white). The wave type is 4 (yellow)
—
The fourth and fifth columns of data are the low and high range. Low range value is 5 (white) and high range value is 2 (green) – which doesn’t make sense, but this is simulator data.
—
The last column is the modulator destination activity indicator: grey if zero (not assigned) or white if any non-zero value.
// modulator data structure
// these are fixed structures 8x2, with specific color rules
//
// ulx, uly
// mod id number 1-n
// on	: 0 = off, 1 = on
// modin :  modulation source index 0-4
// clockspeed  :  0-4
// wavetype : 0-4
// lorange : 0-4
// hirange : 0-4
// ingate : 0 - 4  (tells which control is being modulated)
// spare
// destination : 0-127 destination index  // this is displayed elsewhere
//
Adafruit 32×32 RGB LED panel
https://www.adafruit.com/products/1484?gclid=CMzrnYDB1b4CFTQQ7AodjXkAFw

files are also in tkzic/new max radio project/
There is a newer version adapted for the Max radio project – basically same code, but file names are
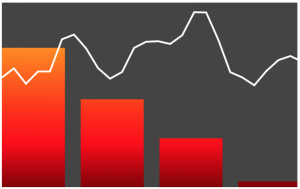
An example of an embedded jsfiddle project:
from Andrew Woolrdidge http://andrewwooldridge.com/blog/2011/03/16/stunning-examples-of-using-jsfiddle/
(Click on result to see a Google Map)


